


If you’ve ever opened up Google Search Console or PageSpeed Insights only to be told:
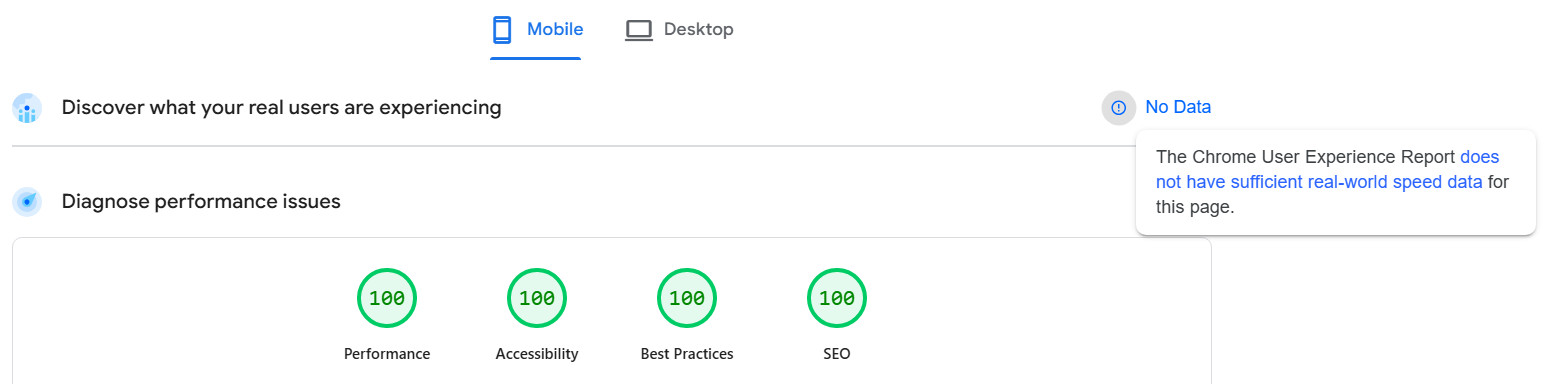
“Not enough usage data in the last 90 days for this device type,” or “The Chrome User Experience Report does not have sufficient real-world speed data for this page.”
…you’re not alone – and you’re definitely not the first to wonder:
How many views do you actually need for Core Web Vitals data to show up?
Let’s break down what’s going on, how Google collects this data, how many visitors you need, and what the difference is between what you see in Google Search Console (GSC) vs PageSpeed Insights (PSI).
💡 What Are Core Web Vitals?
Core Web Vitals are Google’s key performance metrics for user experience. They focus on real-world factors like:
- LCP (Largest Contentful Paint) – loading speed
- INP (Interaction to Next Paint) – interactivity
- CLS (Cumulative Layout Shift) – visual stability
These metrics are part of Google’s ranking algorithm and directly impact your site’s SEO.
Where Does the Data Come From?
The Core Web Vitals data shown in GSC and PSI comes from field data, gathered from Chrome users who have opted into usage statistics. This data is known as the Chrome User Experience Report (CrUX).
If your site doesn’t get much qualifying traffic, you might not see any field data in either tool – especially for a specific device type (mobile or desktop).
🧮 So, How Many Views Do You Need?
Although Google doesn’t give an official number, based on industry findings:
📊 You typically need at least 100 unique Chrome users per device type (mobile/desktop) over a 28-day period for Core Web Vitals data to appear.
Remember:
- Only Chrome users count
- Users must have opted in to usage sharing
- The threshold applies separately to mobile and desktop
- CrUX data is updated every 28 days
🧰 GSC vs. PSI: What’s the Difference?
🔎 Google Search Console (GSC)
- Shows field data only (from CrUX)
- Aggregated across similar URLs – not per URL
- Broken down by device type (mobile/desktop)
- Gives a sitewide performance view, making it more likely to show data for small sites
- May still show “not enough data” if traffic is low
✅ Best for seeing overall trends and long-term performance
🔎 PageSpeed Insights (PSI)
- Shows both field data (if available) and lab data
- Field Data:
- URL-level if there’s enough traffic
- If not, falls back to origin-level (sitewide) data
- Will say something like:
“The Chrome User Experience Report does not have sufficient real-world speed data for this page. Falling back to aggregated data for the origin.”
- Lab Data:
- Simulated in real-time using Lighthouse
- Always available, even if no field data exists
- Strictly per-URL, based on a controlled test environment – not real user traffic
✅ Best for page-specific diagnostics, even for low-traffic pages
✅ Quick Comparison
| Feature | Google Search Console | PageSpeed Insights |
|---|---|---|
| Data type | Field data (real users) | Field + Lab (simulated) |
| URL or sitewide? | Aggregated by similar URLs | Field: URL or origin Lab: URL only |
| Needs traffic to show? | Yes | Field: Yes Lab: No (always available) |
| Device breakdown | Yes (mobile & desktop) | Yes |
🛠 What to Do if There’s “Not Enough Data”
If you’re running a small site (like a personal blog or a small store with <1,000 visits/month), here’s how to work around missing field data:
1. Use Lab Data in PSI
Even without real-user data, Lighthouse gives you performance metrics based on a test simulation of the page you entered.
Use this to:
- Detect large images or slow scripts
- Catch layout shift issues
- See performance scores for LCP, INP, CLS, etc.
2. Optimize Based on Best Practices
Even if field data isn’t available, you can still improve:
- Load speed by reducing server response time and using caching if necessary. Using a fast website builder like UltimateWB can make a huge difference here.
- Interactivity by minimizing JavaScript and improving frontend code
- Stability by setting image dimensions and avoiding layout shifts
3. Grow Chrome Traffic (Slowly but Surely)
Every Chrome user helps build up your CrUX dataset. Focus on long-term traffic growth and keep improving your site experience – the data will eventually show up.
🧾 Recap: Core Web Vitals Visibility
| Question | Answer |
|---|---|
| How many users are needed? | ~100 Chrome users per device in 28 days |
| Does GSC need traffic? | Yes – field data only |
| Does PSI need traffic? | For field data: yes For lab data: no |
| Is lab data sitewide? | ❌ No – it’s URL-specific only |
| Is field data sitewide? | ✅ In GSC, and in PSI if URL has low data |
In Summary
If you’re seeing “Not enough usage data” in GSC or PSI, you’re not doing anything wrong. It’s just a matter of traffic volume, Chrome user activity, and data thresholds.
In the meantime, use lab tools to make smart optimizations and focus on improving your user experience. That way, when your site does reach the threshold, you’ll be in great shape.
Want help running a Lighthouse report or interpreting your PageSpeed scores? Feel free to reach out!
Are you ready to design & build your own website? Learn more about UltimateWB! We also offer web design packages if you would like your website designed and built for you.
Got a techy/website question? Whether it’s about UltimateWB or another website builder, web hosting, or other aspects of websites, just send in your question in the “Ask David!” form. We will email you when the answer is posted on the UltimateWB “Ask David!” section.